Whether you’re building for scale, expanding internationally, or maximising profit from your existing operation, you want a staffing reporting platform that allows you to visualise your model, track your progress and get the most out of your people.
Getting the most out of your staffing reporting platform
If you’ve invested in cube19, here are 5 of my favourite ways to make it even more amazing.
Set priorities across offices, divisions, teams, and individuals in your company.

One of the most powerful areas of cube19 is OneView – the real-time dashboard that keeps every consultant focussed on exceeding growth targets. As a manager it’s incredibly easy to set and edit targets against individual metrics or KPI’s at a team and User level. Simply go into the target section in the admin menu, choose the metric and the timeframe (week or month), input a figure, toggle ‘make this a priority metric’, select your groups or user/s which to apply the target against, and click ok!
You can also add and update targets from OneView and OnPoint by clicking the metric and selecting the Target tab.
Create comparative snapshots to compare teams or individuals performance

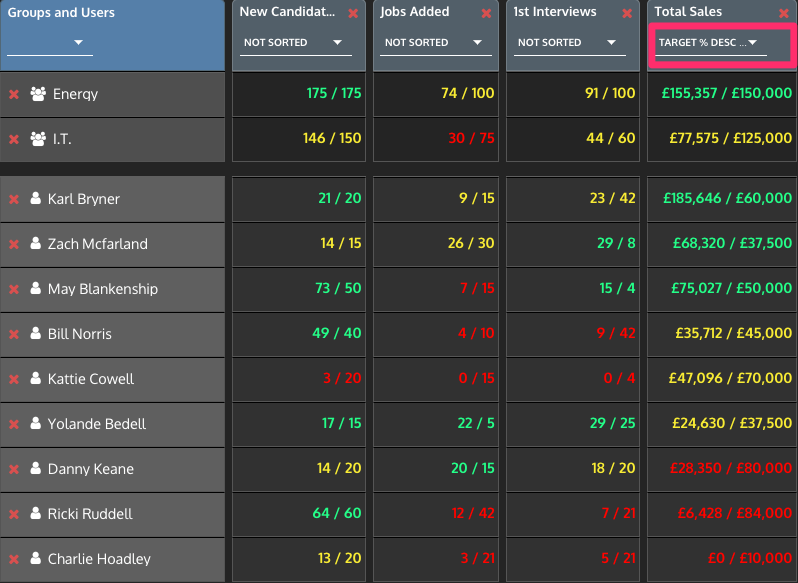
OnPoint allows you to create a dynamic and customisable snapshot comparing how multiple offices, teams or individuals are performing against target across multiple metrics and ratios. It’s the quickest way to see how multiple teams or users are performing at once. We love organising the report by % of target achieved, so consultants of all levels can compete on a level playing field.
Answer any question with simple-to-use, super-fast, ad hoc reporting

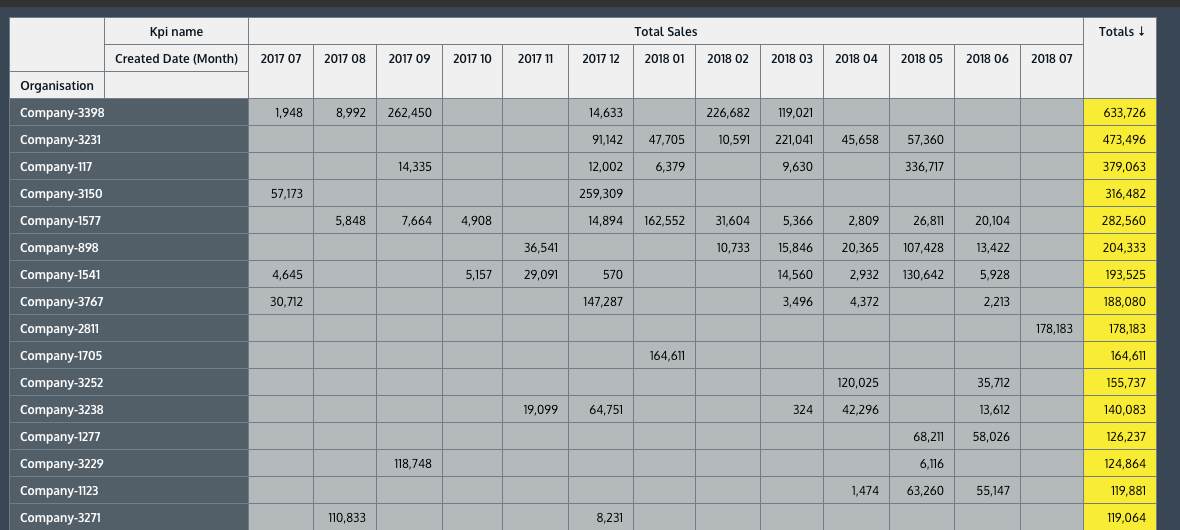
cube19’s Slice & Dice is a drag and drop reporting tool that allows you to analyse your business according to any of your recorded metrics, then segment, filter, sort, re-arrange and drill deeper into that data on the spot. One awesome report is viewing your sales by client by month, to easily see where activity has dropped off, and where it could be an ‘easy win’ to put a call in.
Combine financial data with CRM data

Whether you want to see actuals vs bookings, analyse profits, or simplify the data across a complicated corporate structure with more than one CRM, cube19 brings financial data into one true location you can trust. We encourage everyone to import financial data (eg ‘Actuals’) from finance systems so you can have real-time leaderboards based on monthly billings, not only forecasted revenue.
Access your key data and growth metrics from anywhere
Wake up, rollover, and get an up-to-the-minute snapshot of your business. Check-in from the road. Proudly show your success to current and potential clients. cube19 is mobile friendly. All you have to do is visit https://app.cube19.io
I really hope you found this article useful. If you need any help with implementing the above don’t hesitate to contact our support team.


